LogDoctor
Parse Apache2 / Nginx / IIS logs and view dynamically generated statistics
## Table of contents
- [Overview](#overview)
- [Installation and usage](#installation-and-usage)
- [Requirements / dependencies](#requirements--dependencies)
- [Usage without installation](#usage-without-installation)
- [Usage with installation](#usage-with-installation)
- [How to compile](#how-to-compile)
- [Updates](#updates)
- [Version check](#version-check)
- [How to update](#how-to-update)
- [Before to start](#before-to-start)
- [Logs data](#logs-data)
- [Storage](#storage)
- [Examined fields](#examined-fields)
- [Logs options](#logs-options)
- [Usage control](#usage-control)
- [Logs path](#logs-path)
- [Logs format](#logs-format)
- [Apache2](#apache2)
- [Nginx](#nginx)
- [IIS](#iis)
- [Blacklist](#blacklist)
- [Warnlist](#warnlist)
- [Statistics](#statistics)
- [Warnings](#warnings)
- [Counts](#counts)
- [Speed](#speed)
- [Time of day](#time-of-day)
- [Relational](#relational)
- [Extra features](#extra-features)
- [Log files viewer](#log-files-viewer)
- [Block note](#block-note)
- [Games](#games)
- [Final considerations](#final-considerations)
- [Backups](#backups)
- [Estimated working speed](#estimated-working-speed)
- [Languages](#languages)
- [Contributions](#contributions)
- [Translations](#translations)
## Overview
LogDoctor is a web servers' access logs parser which allows to view dynamic satistics of the collected data.
Supported web servers are **Apache2**, **Nginx** and **IIS**.
LogDoctor is a hard fork of [Craplog](https://git.disroot.org/elB4RTO/CRAPLOG).
## Installation and usage
### Requirements / Dependencies
- **From binary**:
- C++ 20
- Qt6 *(Framework 6.6+, Linguist, Widgets, Charts, Sql, Network)*
- **From source**:
- *all the above*
- CMake
- gcc / clang / msvc
- **As Docker**:
- Docker
### Usage without installation
- Download a pre-compiled [Release](https://git.disroot.org/elB4RTO/LogDoctor/releases)
*or*
Follow the step-by-step guide in [HOW_TO_COMPILE.md](https://git.disroot.org/elB4RTO/LogDoctor/src/branch/main/HOW_TO_COMPILE.md)
- Run the executable
### Usage with installation
See [HOW_TO_INSTALL.md](https://git.disroot.org/elB4RTO/LogDoctor/src/branch/main/HOW_TO_INSTALL.md)
### How to compile
See [HOW_TO_COMPILE.md](https://git.disroot.org/elB4RTO/LogDoctor/src/branch/main/HOW_TO_COMPILE.md)
## Updates
### Version check
A version check utility is available while running LogDoctor to check the availability of a new version.
To check for updates, open the menu `Utilities`→`Version check`.
### How to update
See [HOW_TO_UPDATE.md](https://git.disroot.org/elB4RTO/LogDoctor/src/branch/main/HOW_TO_UPDATE.md)
## Before to start
When you run LogDoctor for the first time, please take a minute to set-up the things it needs.
Head to the **configurations** section and give a look at least at the [logs format](#logs-format) settings. You have to tell the doctor what he'll be dealing with!
## Logs data
Archived (**gzipped**) log files can be used as well as normal files.
### Storage
Parsed data will be stored in an [SQLite](https://www.sqlite.org/about.html) database, which makes it easy to transport/view/edit it as you please.
If LogDoctor's funcionalities aren't enough for your needs, you can always use a *DB manager* or the SQLite *API* to make your own queries and retrieve the data you need.
### Examined fields
Not all the available log fields (expecially for *Apache2* and *Nginx*) are taken into consideration.
The considered fields are:
- **Date** and **Time**
- Request stuff: **Protocol**, **Method**, **URI** and **Query**
- Server stuff: **Bytes received**, **Bytes sent** and **Time taken**
- Client stuff: **User-agent**, **IP address**, **Cookie** and **Referrer site**
Further informations can be found in the [wiki](https://git.disroot.org/elB4RTO/LogDoctor/wiki/Examined-fields) or while running LogDoctor.
### Logs options
Various options can be configured about log files.
#### Usage control
When you parse a file, it will be hashed using the **SHA256** algorithm and the hash will be stored in another database, to keep track of which files you've already used and help you not parsing them twice.
##### Note
If you don't know, *SHA256* produces an irreversible hash, which means that no information about the file can be retrieved from the hash.
You have full control on the hashes database (same as for the logs-data database): you can move, delete, view or edit it the way you want (but you must keep the original file-name).
LogDoctor will **never** grab and/or use any information about you or the usage you make of it.
#### Logs path
A different logs path can be used for any of the three supported *Web Servers*.
It can be the default system folder or any folder you decide to use, just set it in the options.
#### Logs format
Before to start parsing logs, you must set-up the *log format* that LogDoctor will have to use.
Head to the **configurations** section, tap `Logs`, select the **Web Server** you want to configure and tap `Format`.
Once inside the **Format** section, you can insert the *log format string* you're using. Don't forget to use the `Generete preview` button to generate a *log line sample* and **check the correctness** of the format!
For reliability reasons, LogDoctor **does not** support the usage of the **Carriage Return** inside the log format string.
##### Apache2
The log format string must be specified. Any format is supported, if valid.
To retrieve your format string:
- open the configuration file `/etc/apache2/apache2.conf`
- *usually*, the line you're looking for is the one starting with `LogFormat` and ending with `combined`. It should be somewhere near to the end of the file.
- you must not paste the whole line, just the part holding the *format string*.
Example:
- this is the whole line:
```
LogFormat "%h %l %u %t \"%r\" %>s %b \"%{Referer}i\" \"%{User-agent}i\"" combined
```
- this is the *format string*:
```
%h %l %u %t \"%r\" %>s %b \"%{Referer}i\" \"%{User-agent}i\"
```
please notice that you have to remove the enclosing quotes/apostrophes as well
More informations can be found in the [wiki](https://git.disroot.org/elB4RTO/LogDoctor/wiki/Apache2) or while setting the format.
##### Nginx
The log format string must be specified. Any format is supported, if valid.
To retrieve your format string:
- open the configuration file `/usr/local/etc/nginx/nginx.conf`
- *usually*, the line you're looking for is the one starting with `log_format main`. It should be somwehere in the middle of the file
- one **important** thing: don't paste the indentations and new lines! The default line is usualy declared in consecutive lines, and indented. You must reduce it to a one consecutive string (by also removing the *apostrophes* in the middle of it). The best way is to do this job inside the configuration file, then save and restart Nginx to see if any error is thrown.
Example:
- this is the whole line:
```
log_format main '$remote_addr - $remote_user [$time_local] '
'"$request" $status $body_bytes_sent '
'"$http_referer" "$http_user_agent" "$gzip_ratio"';
```
- this is the resulting *format string*:
```
$remote_addr - $remote_user [$time_local] "$request" $status $bytes_sent "$http_referer" "$http_user_agent" "$gzip_ratio"
```
please notice that you have to remove the enclosing apostrophes/quotes as well
More informations can be found in the [wiki](https://git.disroot.org/elB4RTO/LogDoctor/wiki/Nginx) or while setting the format.
##### IIS
Supported log formats are: **W3C**, **NCSA** and **IIS**.
The *NCSA* and *IIS* modules doesn't allow any modification from the user, so nothing more have to be specified.
The *W3C* module instead allows the user to decide which fields to log, and thus you must declare the *log format string* you're using.
To retrieve your format string (for the *W3C* module only):
- open any of the log files which have been generated by this module
- the line you're looking for is the one starting with `#Fields:`, usually at the beginning of the file.
Example:
- this is the whole line:
```
#Fields: date time s-ip cs-method cs-uri-stem cs-uri-query s-port cs-username c-ip cs(User-Agent) cs(Referer) sc-status sc-substatus sc-win32-status time-taken
```
- this is the *format string*:
```
date time s-ip cs-method cs-uri-stem cs-uri-query s-port cs-username c-ip cs(User-Agent) cs(Referer) sc-status sc-substatus sc-win32-status time-taken
```
More informations can be found in the [wiki](https://git.disroot.org/elB4RTO/LogDoctor/wiki/IIS) or while setting the format.
#### Blacklist
You can add elements to the **blacklist** to avoid storing the lines containing those elements.
Each web server has its own list.
#### Warnlist
As for the *blacklist*, you can add elements to the **warnlist**.
*Warnlists* will mark with a **warning** the lines triggering them. Warnings can be viewed in the relative [statistics](#warnings) section.
Each web server has its own lists.
## Statistics
Most of the *statistics sections* allows you to set filters to the log fields, to skim data by only including lines matching those parameters.
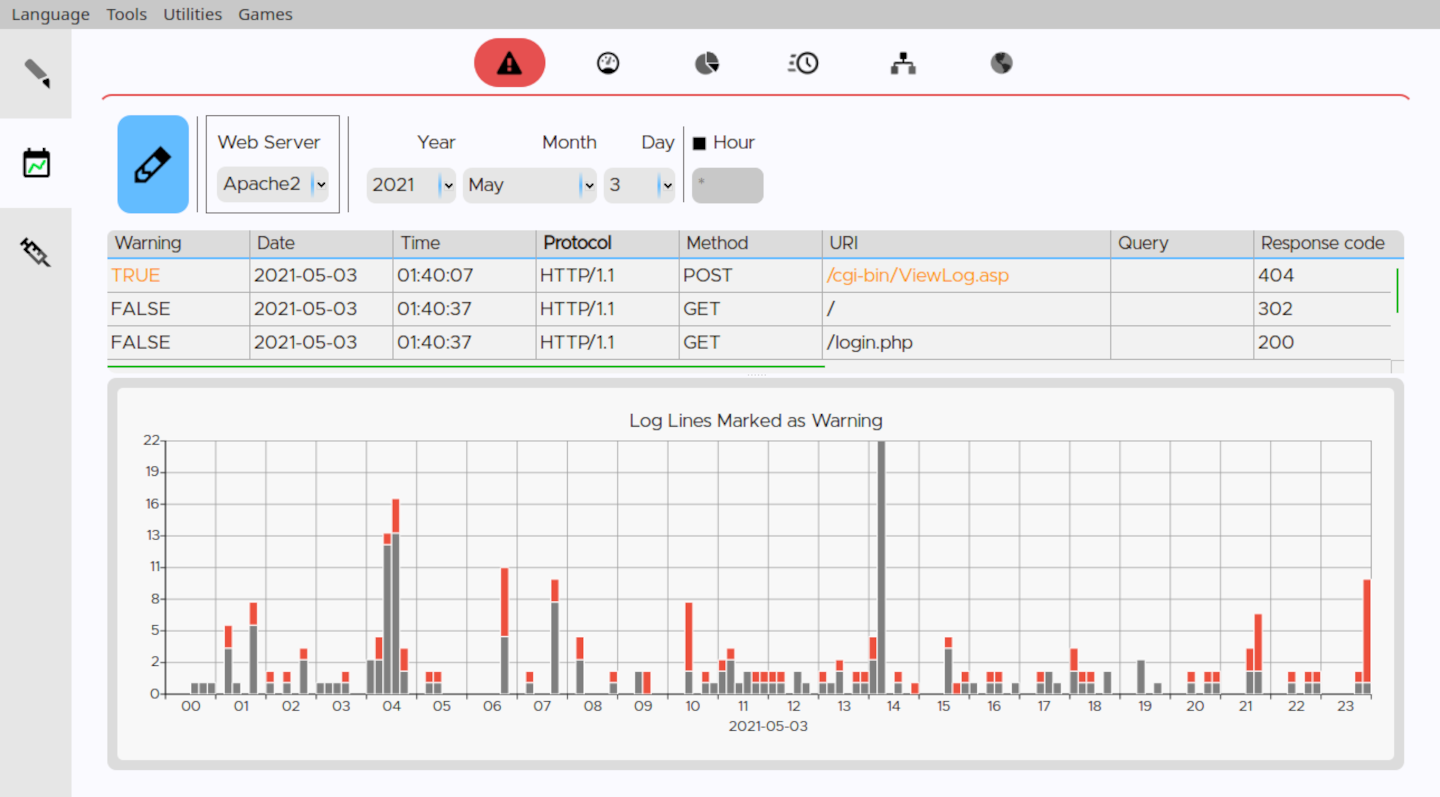
### Warnings
In the *warning* section you can view the lines which are triggering a warning.
Warnings are generated dinamically depending on your [warnlists](#warnlist): changing the elements in the *warnlists* will produce different warnings.
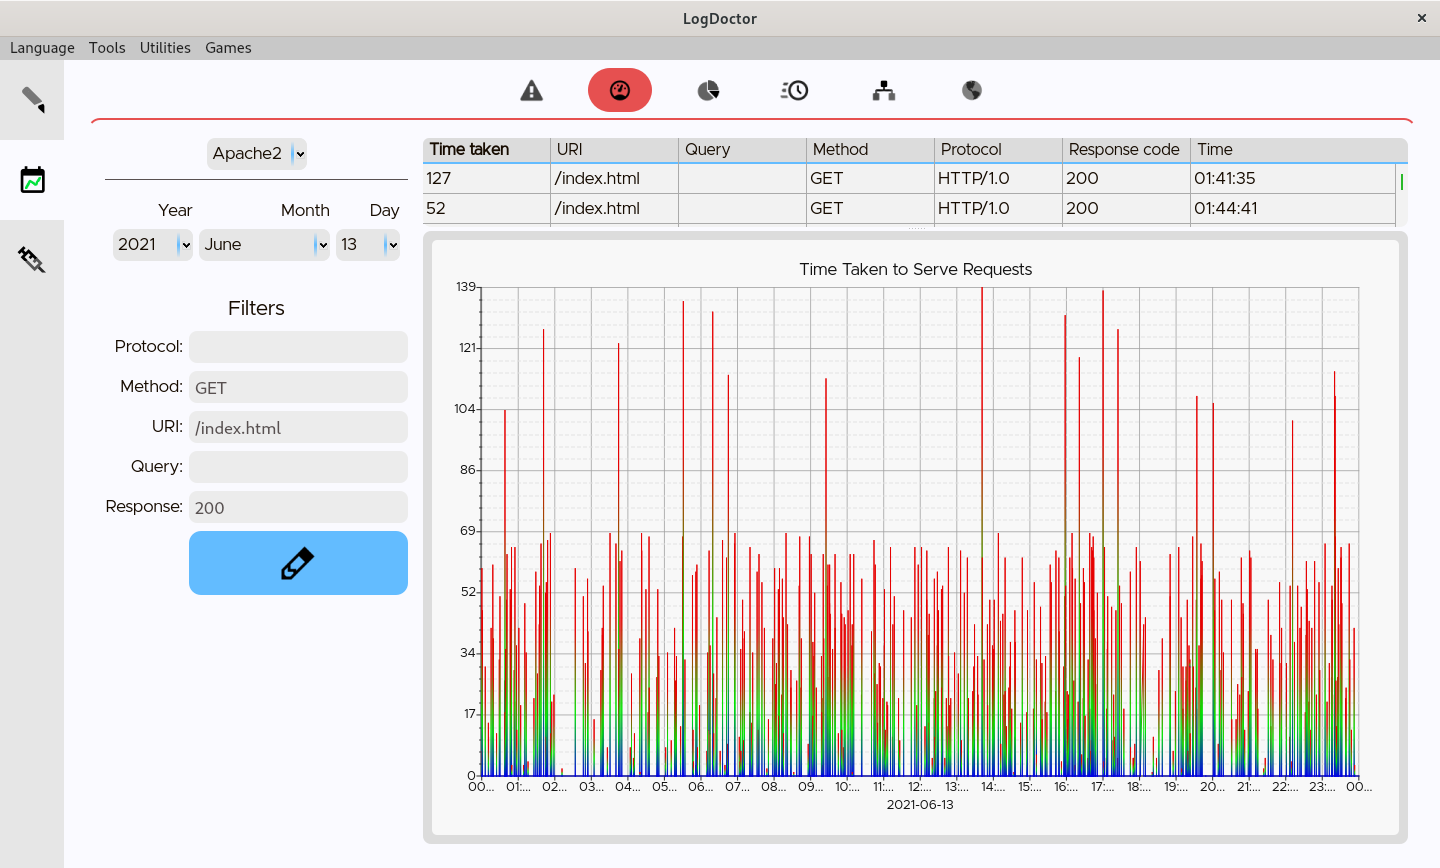
### Speed
In the *speed* section you can view how fast has been your server at serving contents (if you logged the *time taken*, of course).
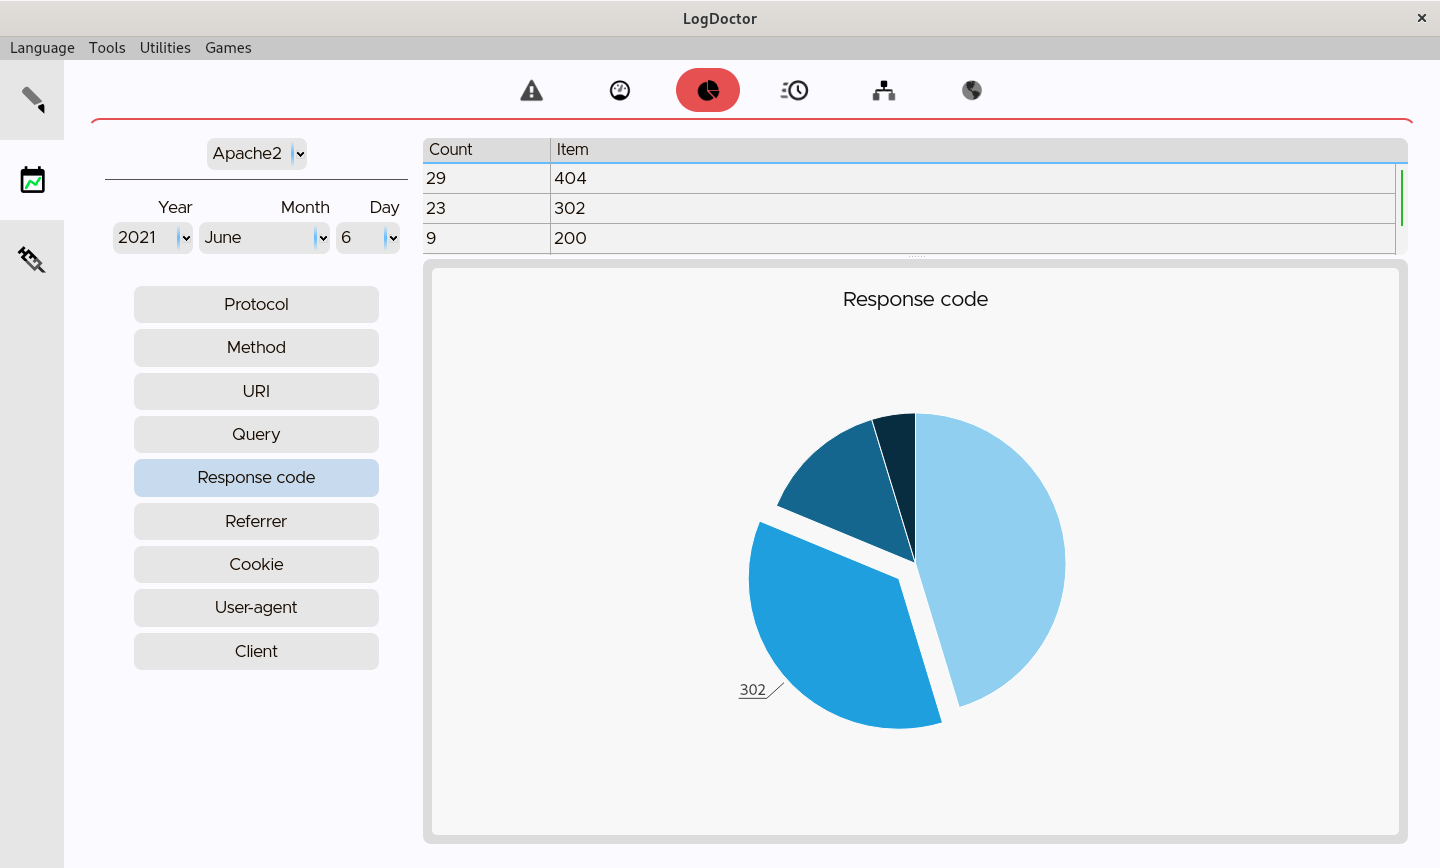
### Counts
The *count* section is very simple. It just shows the recurrence of the elements for a specific field.
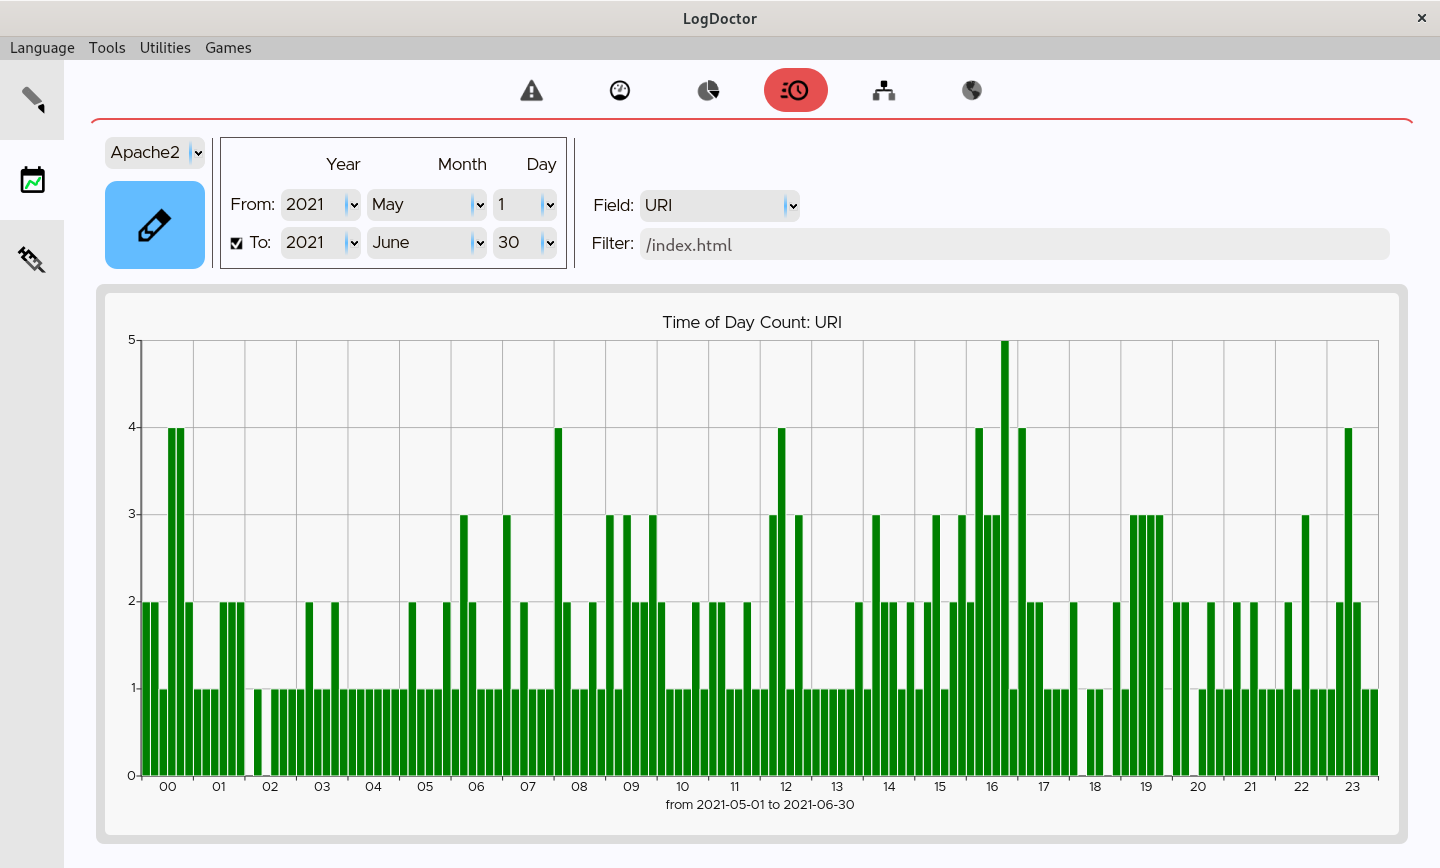
### Time of day
In the *time of day* section you can see the traffic, in terms of number of requests logged.
When viewing a period of time, the mean value (of all the logged days in that period) is shown.
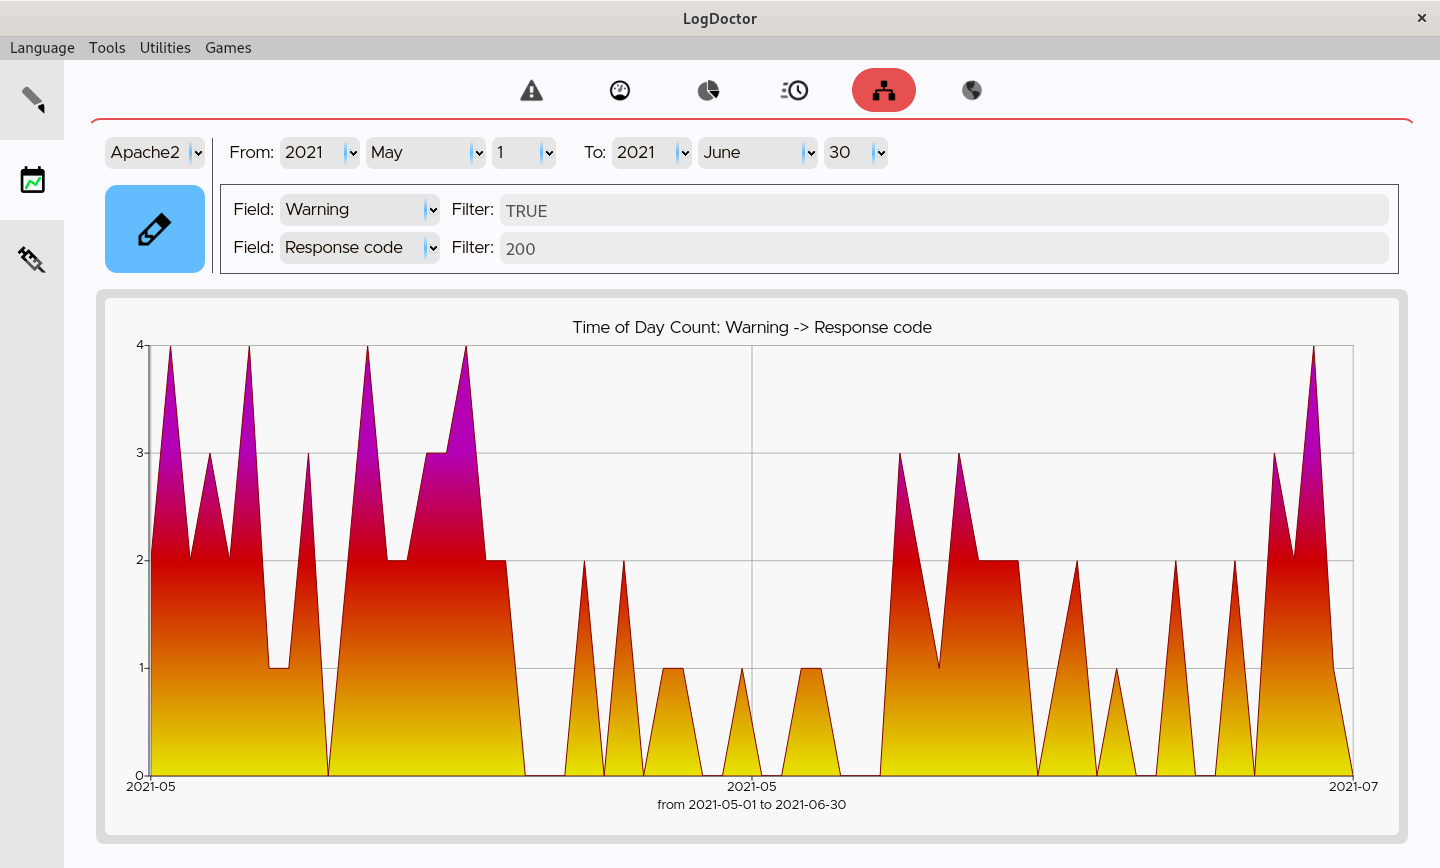
### Relational
In the *relational* section you can view how many times a specific field brought to another.
This section is more suited for long periods of time.
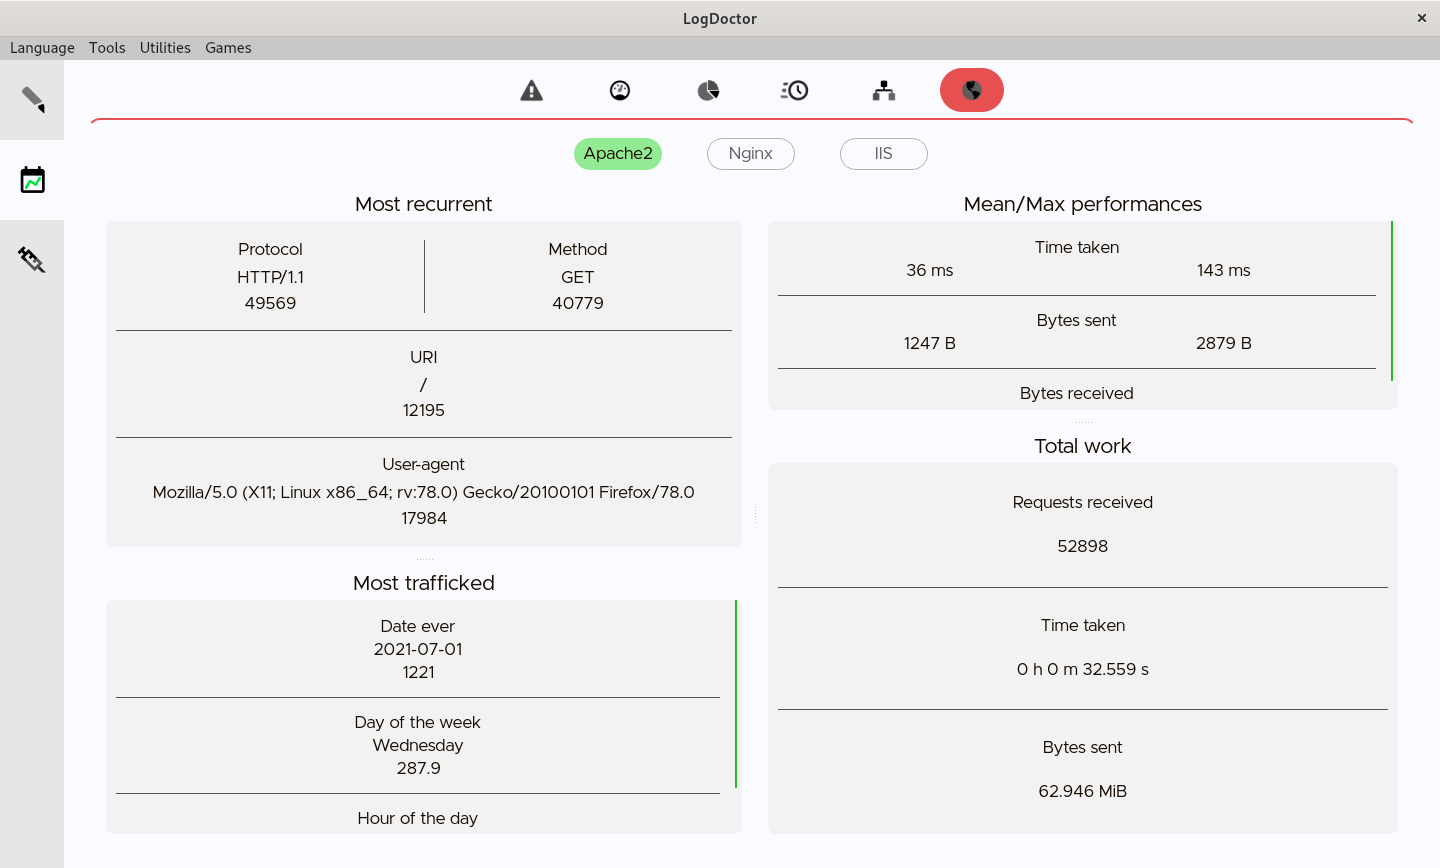
### Globals
In the *globals* section you can have an overview of your logs history.
## Extra features
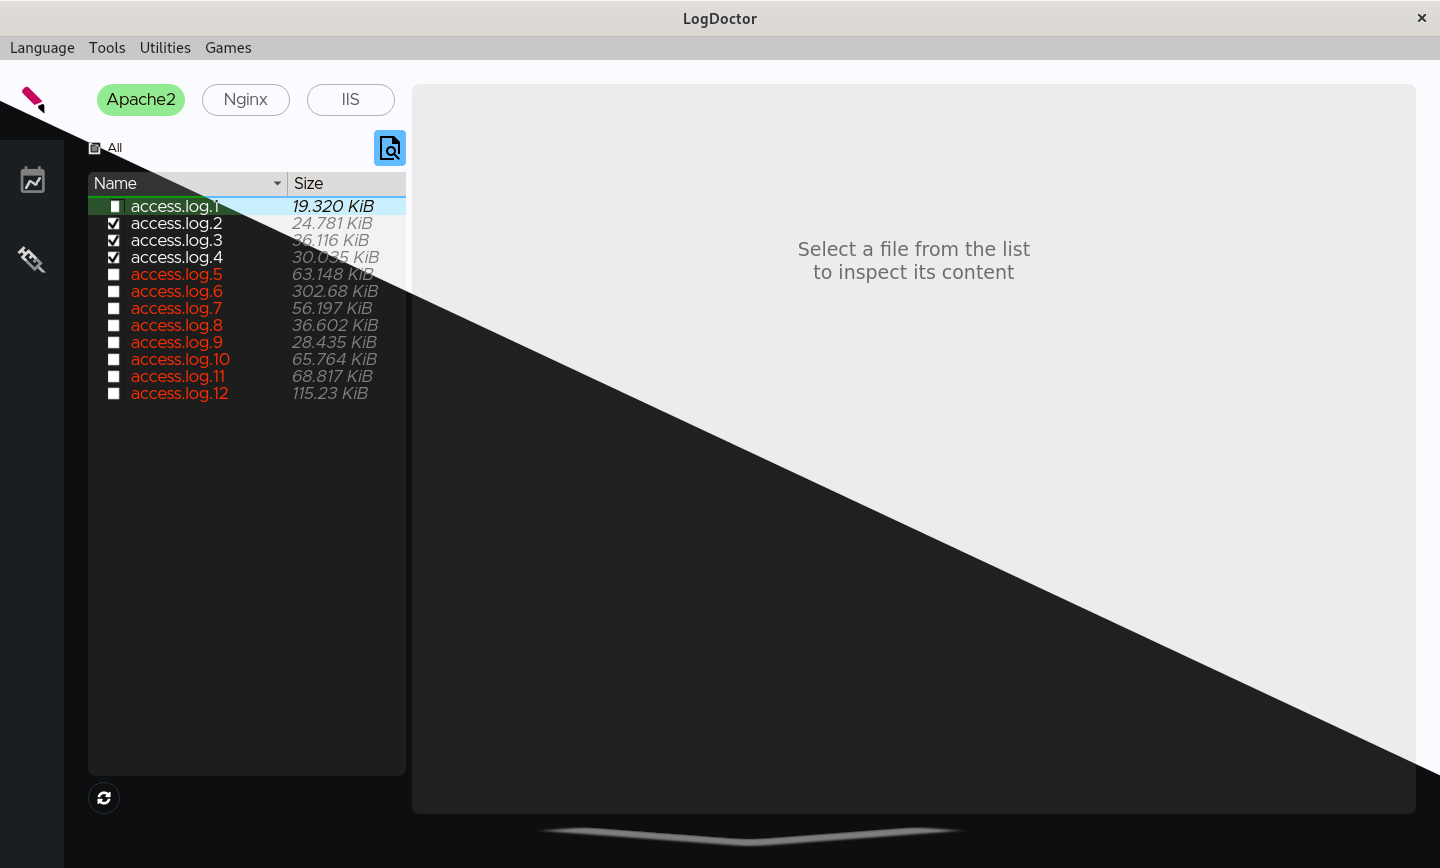
### Log files viewer
Use the built-in logs viewer to inspect the content of your log files.
Color schemes will be applied using the currently set log format.
### Block-note
A block-note utility is available at `Tools`→`BlockNote` which can be used to temporary write text, notes, etc.
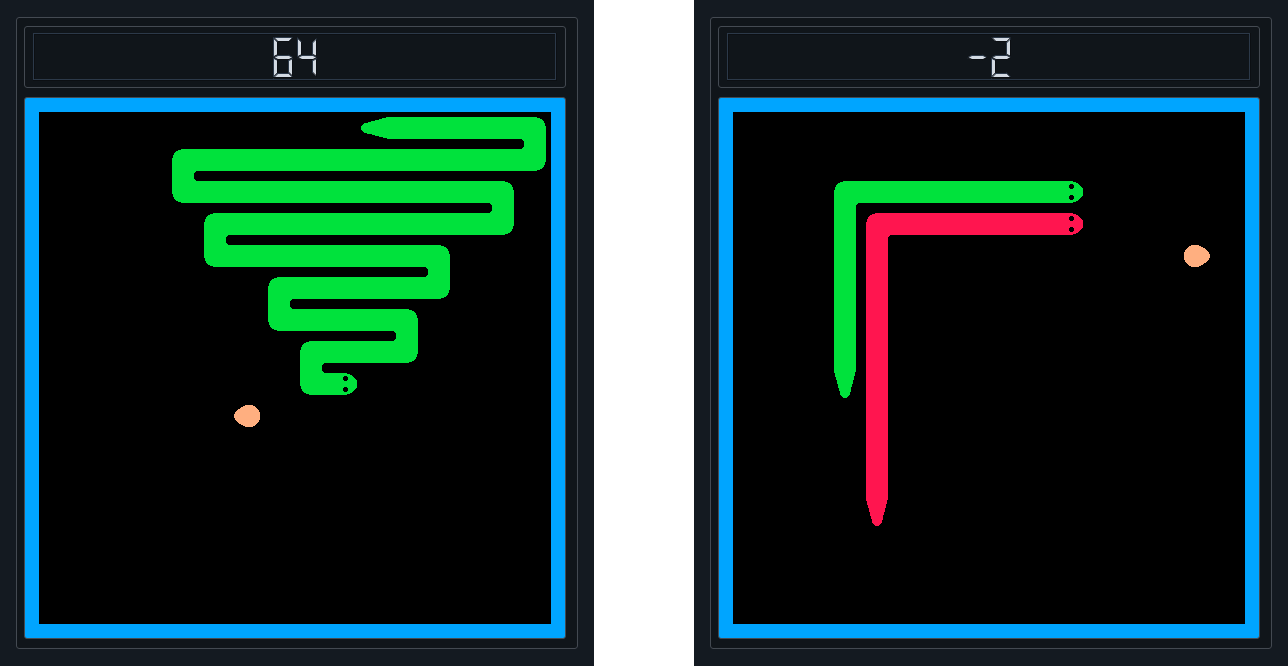
### Games
Simple mini-games to kill the time
#### CrissCross

#### Snake
## Final considerations
### Backups
LogDoctor can automatically do a backup of your **logs database** file, so you can recover your data in case something goes wrong.
Move inside LogDoctor's folder (if you don't know/remember the path, open the `Utilities`→`Infos`>`Paths` menu to view it) and open the folder named "**backups**'.
Here you will find the backups with an increasing index, where '.1' represents the newest.
A new backup is made every time you quit LogDoctor after doing a job which affected the database in any way.
#### Note
Only the *logs-data database* will be backed-up, the *hashes database* **won't**.
This is because it is unlikely (supposedly impossible) that a hash equals another, therefore they're supposed to be useful for a short period of time (that is, since you or your web server delete the original log files).
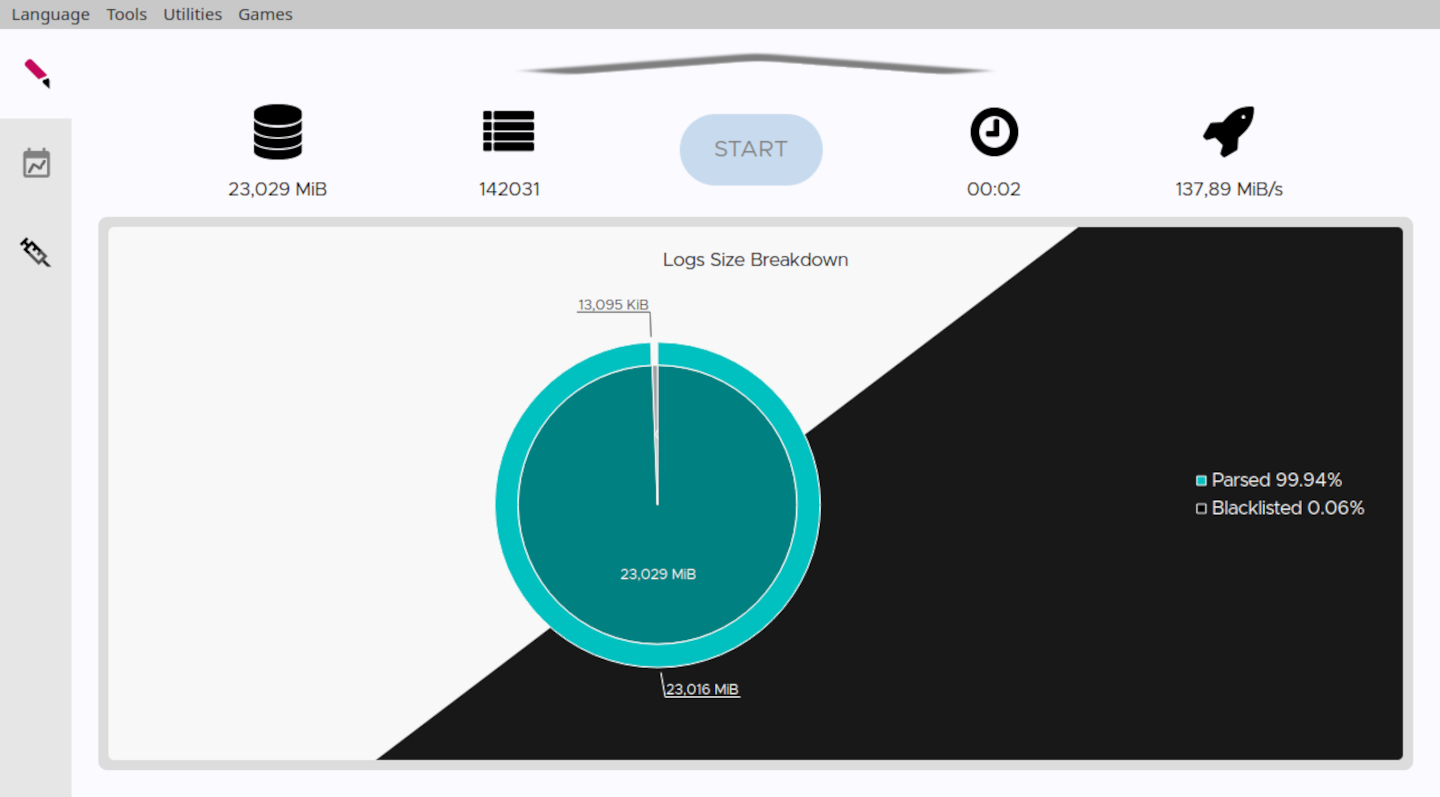
### Estimated working speed
10~200 MB/s
May be higher or lower depending on the complexity of the logs, the complexity of the blacklist, the build type, your hardware and the workload of your system during the execution.
## Languages
LogDoctor is available in:
- 🇬🇧 **English** (100%)
- 🇮🇹 **Italian** (100%)
- 🇪🇸 **Spanish** (90%, *wanna [contribute](https://git.disroot.org/elB4RTO/LogDoctor/src/branch/main/TRANSLATING.md)?*)
- 🇫🇷 **French** (90%, *wanna [contribute](https://git.disroot.org/elB4RTO/LogDoctor/src/branch/main/TRANSLATING.md)?*)
- 🇧🇷 **Portuguese** [**Brazil**] (90%, *wanna [contribute](https://git.disroot.org/elB4RTO/LogDoctor/src/branch/main/TRANSLATING.md)?*)
- 🇯🇵 **Japanese** (90%, *wanna [contribute](https://git.disroot.org/elB4RTO/LogDoctor/src/branch/main/TRANSLATING.md)?*)
## Contributions
LogDoctor is under development.
If you have suggestions about how to improve it, please open an [issue](https://git.disroot.org/elB4RTO/LogDoctor/issues).
If you want to contribute to the code, please read the [Contribution Guidelines](https://git.disroot.org/elB4RTO/LogDoctor/src/branch/main/CONTRIBUTING.md).
If you want to contribute to the translation, please read the [Translation Guidelines](https://git.disroot.org/elB4RTO/LogDoctor/src/branch/main/TRANSLATING.md).