6.9 KiB
Reversing Tools
Wasm decompiler
https://www.pnfsoftware.com/jeb/demowasm
.Net decompiler
https://github.com/icsharpcode/ILSpy
ILSpy plugin for Visual Studio Code: You can have it in any OS you can install it directly from VSCode, no need to download the git. Click on **Extensions** and **search ILSpy**.
If you need to decompile, modify and recompile again you can use: https://github.com/0xd4d/dnSpy/releases **Right Click -> Modify Method** to change something inside a function.
You cloud also try https://www.jetbrains.com/es-es/decompiler/
DNSpy Logging
In order to make DNSpy log some information in a file, you could use this .Net lines:
using System.IO;
path = "C:\\inetpub\\temp\\MyTest2.txt";
File.AppendAllText(path, "Password: " + password + "\n");
DNSpy Debugging
In order to debug code using DNSpy you need to:
First, change the Assembly attributes related to debugging:
From:
[assembly: Debuggable(DebuggableAttribute.DebuggingModes.IgnoreSymbolStoreSequencePoints)]
To:
[assembly: Debuggable(DebuggableAttribute.DebuggingModes.Default |
DebuggableAttribute.DebuggingModes.DisableOptimizations |
DebuggableAttribute.DebuggingModes.IgnoreSymbolStoreSequencePoints |
DebuggableAttribute.DebuggingModes.EnableEditAndContinue)]
And click on compile:
Then save the new file on File >> Save module...:
This is necessary because if you don't do this, at runtime several optimisations will be applied to the code and it could be possible that while debugging a break-point is never hit or some variables don't exist.
Then, if your .Net application is being run by IIS you can restart it with:
iisreset /noforce
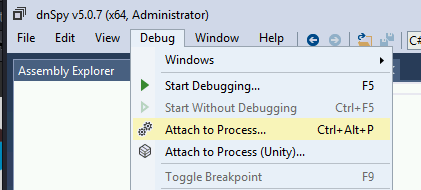
Then, in order to start debugging you should close all the opened files and inside the Debug Tab select Attach to Process...:
Then select w3wp.exe to attach to the IIS server and click attach:
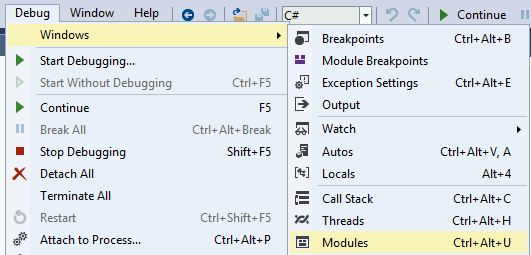
Now that we are debugging the process, it's time to stop it and load all the modules. First click on Debug >> Break All and then click on Debug >> Windows >> Modules:
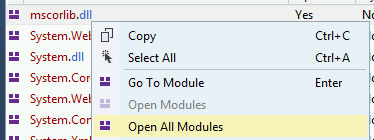
Click any module on Modules and select Open All Modules:
Right click any module in Assembly Explorer and click Sort Assemblies:
Java decompiler
https://github.com/skylot/jadx
https://github.com/java-decompiler/jd-gui/releases
Debugging DLLs
Using IDA
- Load rundll32
64bits in C:\Windows\System32\rundll32.exe and 32 bits in C:\Windows\SysWOW64\rundll32.exe - Select Windbg debugger
- Select "Suspend on library load/unload"
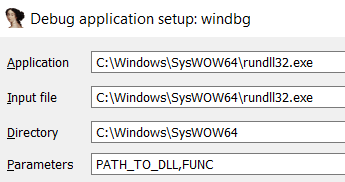
- Configure the parameters of the execution putting the path to the DLL and the function that you want to call:
Then, when you start debugging the execution will be stopped when each DLL is loaded, then, when rundll32 load your DLL the execution will be stopped.
But, how can you get to the code of the DLL that was lodaded? Using this method, I don't know how.
Using x64dbg/x32dbg
- Load rundll32
64bits in C:\Windows\System32\rundll32.exe and 32 bits in C:\Windows\SysWOW64\rundll32.exe - Change the Command Line
_File --> Change Command Line_and set the path of the dll and the function that you want to call, for example: "C:\Windows\SysWOW64\rundll32.exe" "Z:\shared\Cybercamp\rev2\14.ridii_2.dll",DLLMain - Change Options --> Settings and select "DLL Entry".
- Then start the execution, the debugger will stop at each dll main, at some point you will stop in the dll Entry of your dll. From there, just search for the points where you want to put a breakpoint.
Notice that when the execution is stopped by any reason in win64dbg you can see in which code you are looking in the top of the win64dbg window:
Then, looking to this ca see when the execution was stopped in the dll you want to debug.
ARM & MIPS
{% embed url="https://github.com/nongiach/arm_now" %}
Shellcodes
You should try ****scdbg.
It will tell you things like which functions is the shellcode using and if the shellcode is decoding itself in memory.
scdbg.exe -f shellcode # Get info
scdbg.exe -f shellcode -r #Run it
scdbg.exe -f shellcode -r #Run it with hooks
scdbg.exe -f shellcode -d #Dump decoded shellcode
scdbg.exe -f shellcode /findsc #Find offset where starts
To run a shellcode you can also use: http://mcdermottcybersecurity.com/articles/windows-x64-shellcode#testing
Movfuscator
This ofuscator change all the instructions for movyeah, really cool. It also uses interruptions to change executions flows. For more information about how does it works:
- https://www.youtube.com/watch?v=2VF_wPkiBJY
- https://github.com/xoreaxeaxeax/movfuscator/blob/master/slides/domas_2015_the_movfuscator.pdf
If you are lucky demovfuscator will deofuscate the binary. It has several dependencies
apt-get install libcapstone-dev
apt-get install libz3-dev
And install keystone `apt-get install cmake; mkdir build; cd build; ../make-share.sh; make install`
If you are playing a CTF, this workaround to find the flag could be very useful: https://dustri.org/b/defeating-the-recons-movfuscator-crackme.html
Delphi
For Delphi compiled binaries you can use https://github.com/crypto2011/IDR
Courses
- https://github.com/0xZ0F/Z0FCourse_ReverseEngineering
- https://github.com/malrev/ABD
Binary deobfuscation


